Introducing DriveStats v2.0: Smart Fuel Insights Without Hardware
What if your phone could tell you exactly how much each trip costs — without plugging in a single device?
DriveStats v2.0 is our biggest update yet. We've built a completely new way to track your fuel costs, powered entirely by physics and your iPhone's built-in sensors. No OBD-II dongles. No cables. No manual logging. Just drive.
The Problem With Fuel Tracking Today
If you've ever tried to figure out your real driving costs, you know the options aren't great:
- OBD-II dongles cost $20–50, pair over Bluetooth (when they feel like it), and drain your car's battery if left plugged in.
- Manual logging means remembering to write down your odometer reading and fuel receipts every single time.
- Spreadsheet apps only work if you're disciplined enough to keep them updated.
None of these are automatic. None are private. And none of them tell you the cost of a specific trip — only your average fuel economy over a whole tank.
We thought: there has to be a better way.
How It Works — A Physics-Based Approach
DriveStats v2.0 is built on an advanced vehicle physics model developed from published academic research. It runs entirely on your iPhone — no server-side processing.
The model works by calculating the tractive power your vehicle needs at each point along your route. It factors in:
- Aerodynamic drag — the air resistance you fight at higher speeds
- Rolling resistance — tire friction that increases with speed
- Inertia — the energy required to accelerate your vehicle's mass
- Road grade — the extra power needed to climb hills (and the fuel cut-off when coasting downhill)
This matters because the same car burns dramatically different amounts of fuel depending on conditions:
- Idling in stop-and-go traffic — you're burning fuel while going nowhere
- Cruising at 50 km/h on a flat road — near-optimal efficiency
- Doing 120 km/h on the highway — air resistance increases with the square of speed, efficiency drops significantly
- Climbing a steep hill — gravity demands far more energy than flat terrain
Calibrated for Your Vehicle
When you select your car in the app, the model calibrates itself using your vehicle's physical parameters:
- Mass, aerodynamics (drag coefficient & frontal area), and tire rolling resistance — these determine the forces acting on your car
- Engine displacement — used to establish the baseline fuel consumption at idle
- Rated city and highway fuel economy — sourced from official EPA data when available, or from community-contributed data. These calibrate the model's coefficients using standard drive cycles (FTP-75 city, HWFET highway) so it's tuned to your car.
Real-World Example
Here's what this looks like in practice. Say you drive a 2022 Honda Civic and your commute is 18 km each way through a mix of city streets and highway:
- Smooth morning drive (light traffic): DriveStats estimates ~1.1L of fuel, roughly $2.05
- Friday evening gridlock: The same route estimates ~1.5L, roughly $2.80
Same car, same route — but the driving conditions tell a very different story. Over a month, seeing this data for every trip adds up to a clear picture of where your money goes. Keep in mind these are estimates — your actual consumption may vary depending on the factors listed below.
What About Accuracy?
This is a model-based estimate, not a direct measurement from your car's fuel injectors. A gas station receipt can only tell you what you spent for an entire tank — DriveStats gives you something that receipt can't: a cost estimate for each individual trip.
The model captures the major physical forces that affect fuel consumption — speed, acceleration, hills, and vehicle weight. But real-world fuel use depends on many factors the model cannot observe from GPS alone:
- Weather — air conditioning and heating can significantly increase consumption
- Vehicle condition — tire pressure, engine health, and maintenance history all affect real-world fuel use
- Individual variation — even two cars of the same make and model can have different real-world consumption
- Very short trips — DriveStats only tracks GPS while you're actively driving (using significant location changes to conserve battery), so very short drives may have fewer data points for accurate estimation
Where DriveStats excels is relative comparisons — seeing how your commute costs vary day to day, comparing different routes, or tracking your driving efficiency over time. The absolute numbers are estimates, but the trends are meaningful.
Who Is This For?
Daily commuters — See the true cost of your commute broken down by trip, week, or month. Is the highway route actually saving you money?
Road-trippers — Know what each leg of your journey cost. Great for splitting fuel costs with friends.
Rideshare & delivery drivers — Track your actual driving costs per shift to understand your real earnings after fuel.
Small business owners — Estimate fuel costs for business trips without manually logging receipts. Export trip data with fuel costs included.
What's New in v2.0
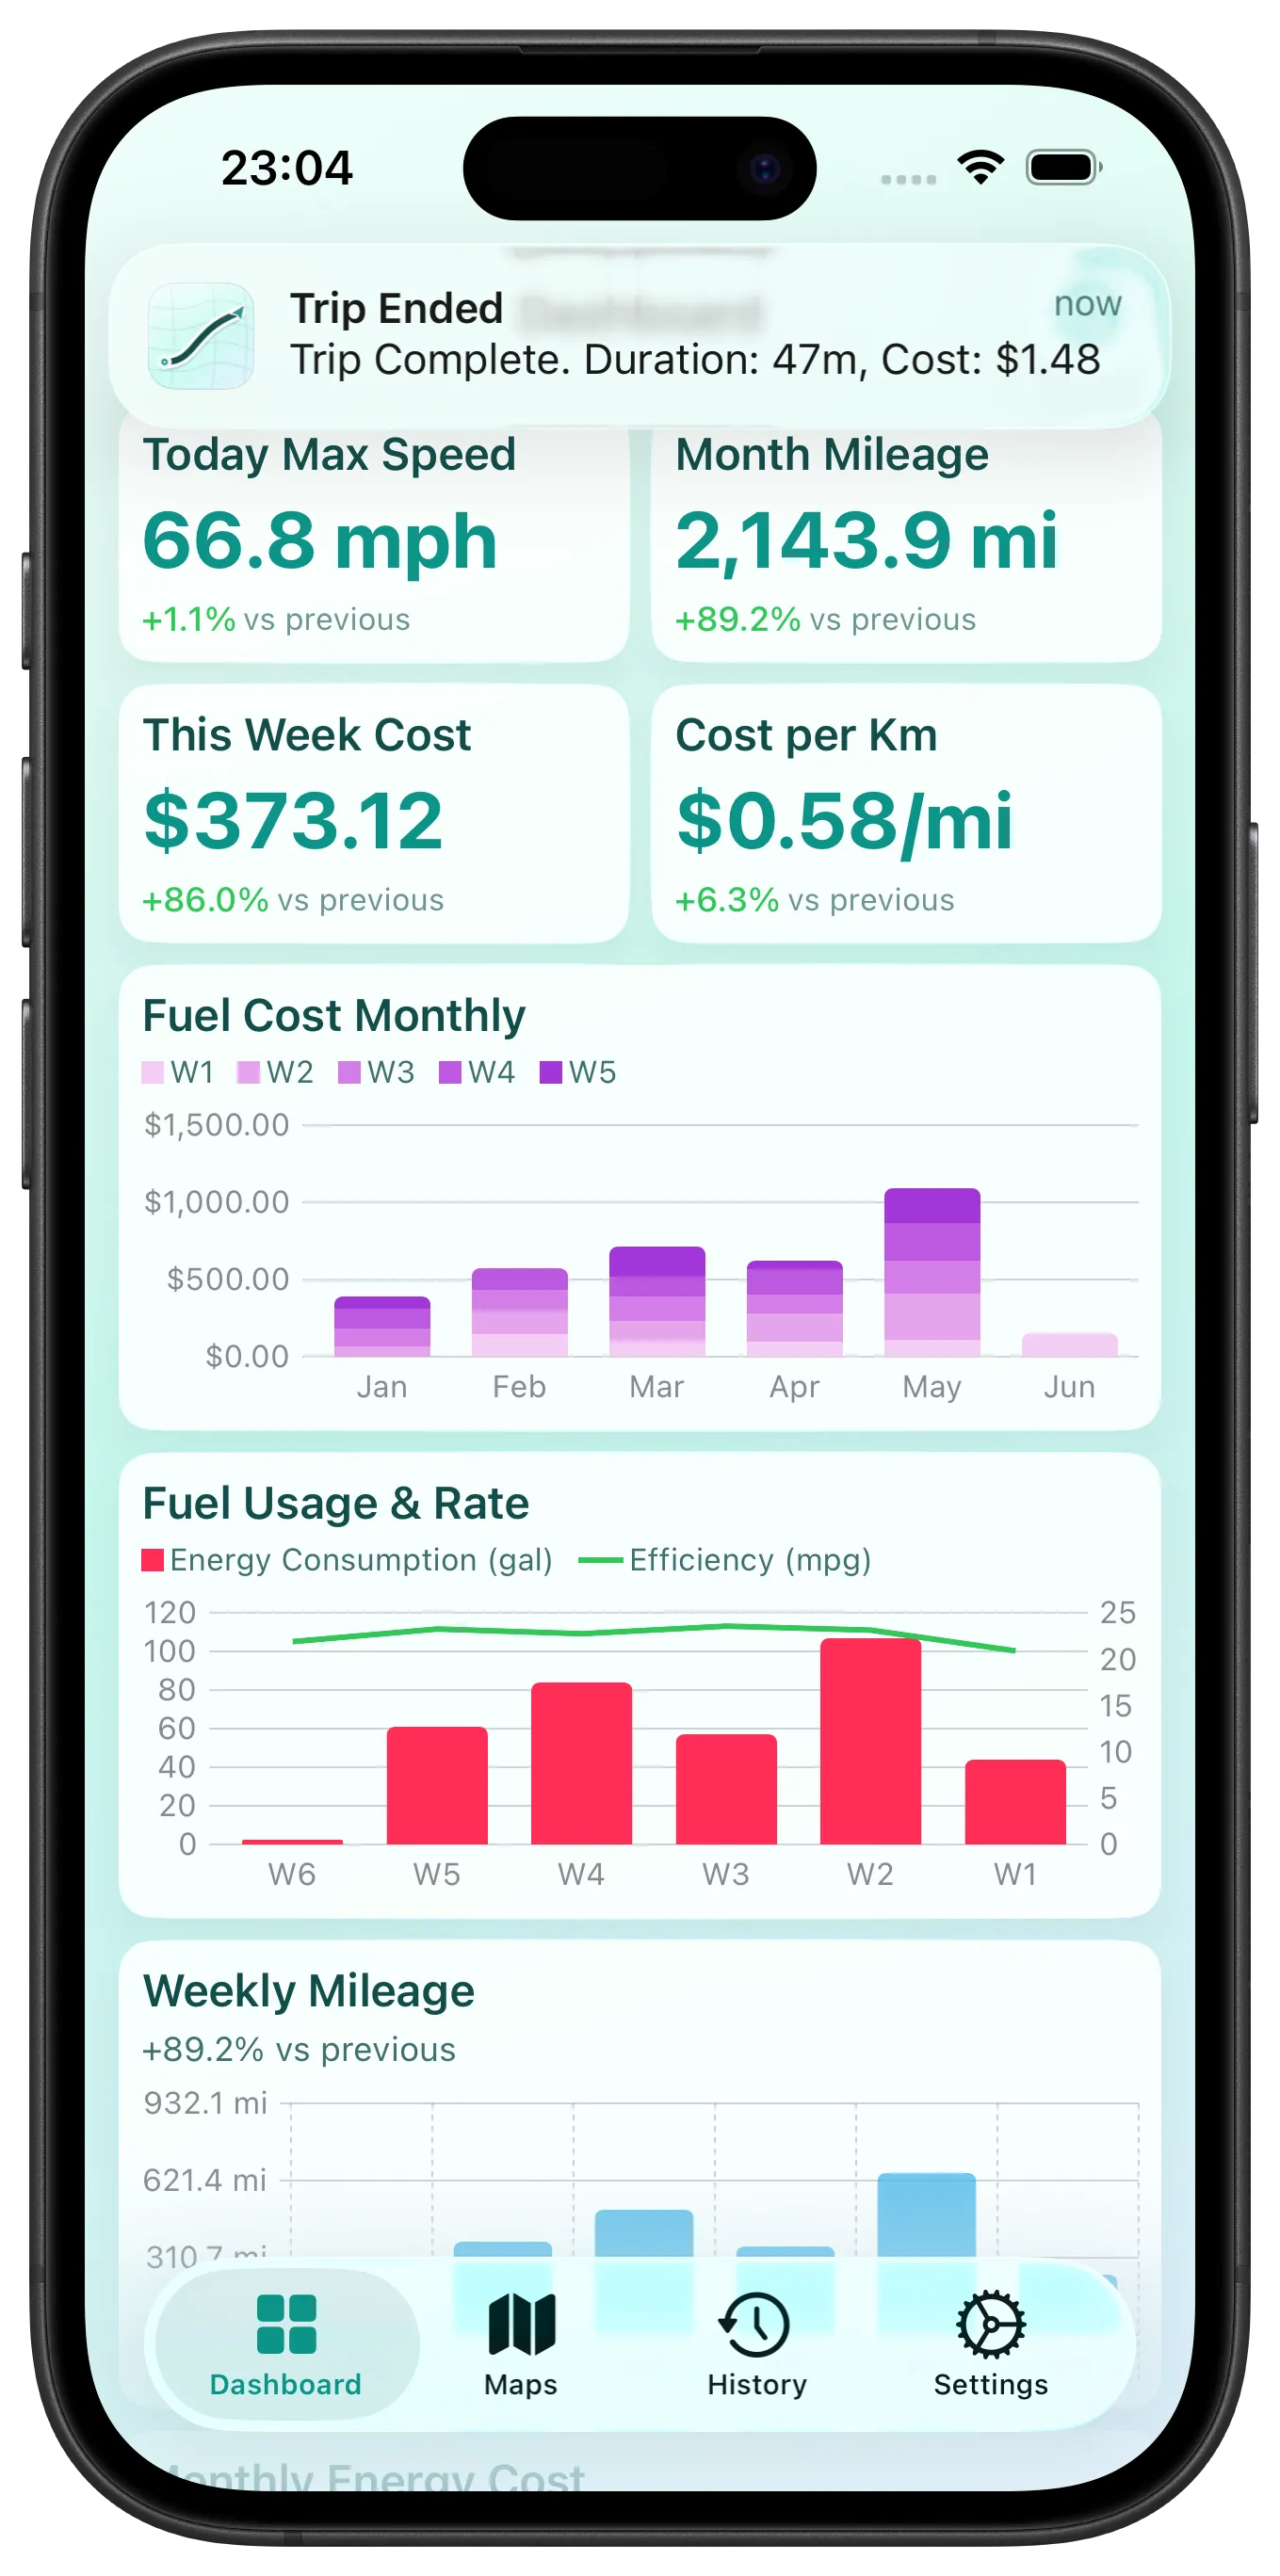
Trip Cost Push Notifications
The moment your trip ends, you get a push notification with the estimated fuel cost. No need to open the app — just a quick glance at your lock screen to see what that drive just cost you.
Fuel Metrics Everywhere
Fuel data is integrated across the entire app:
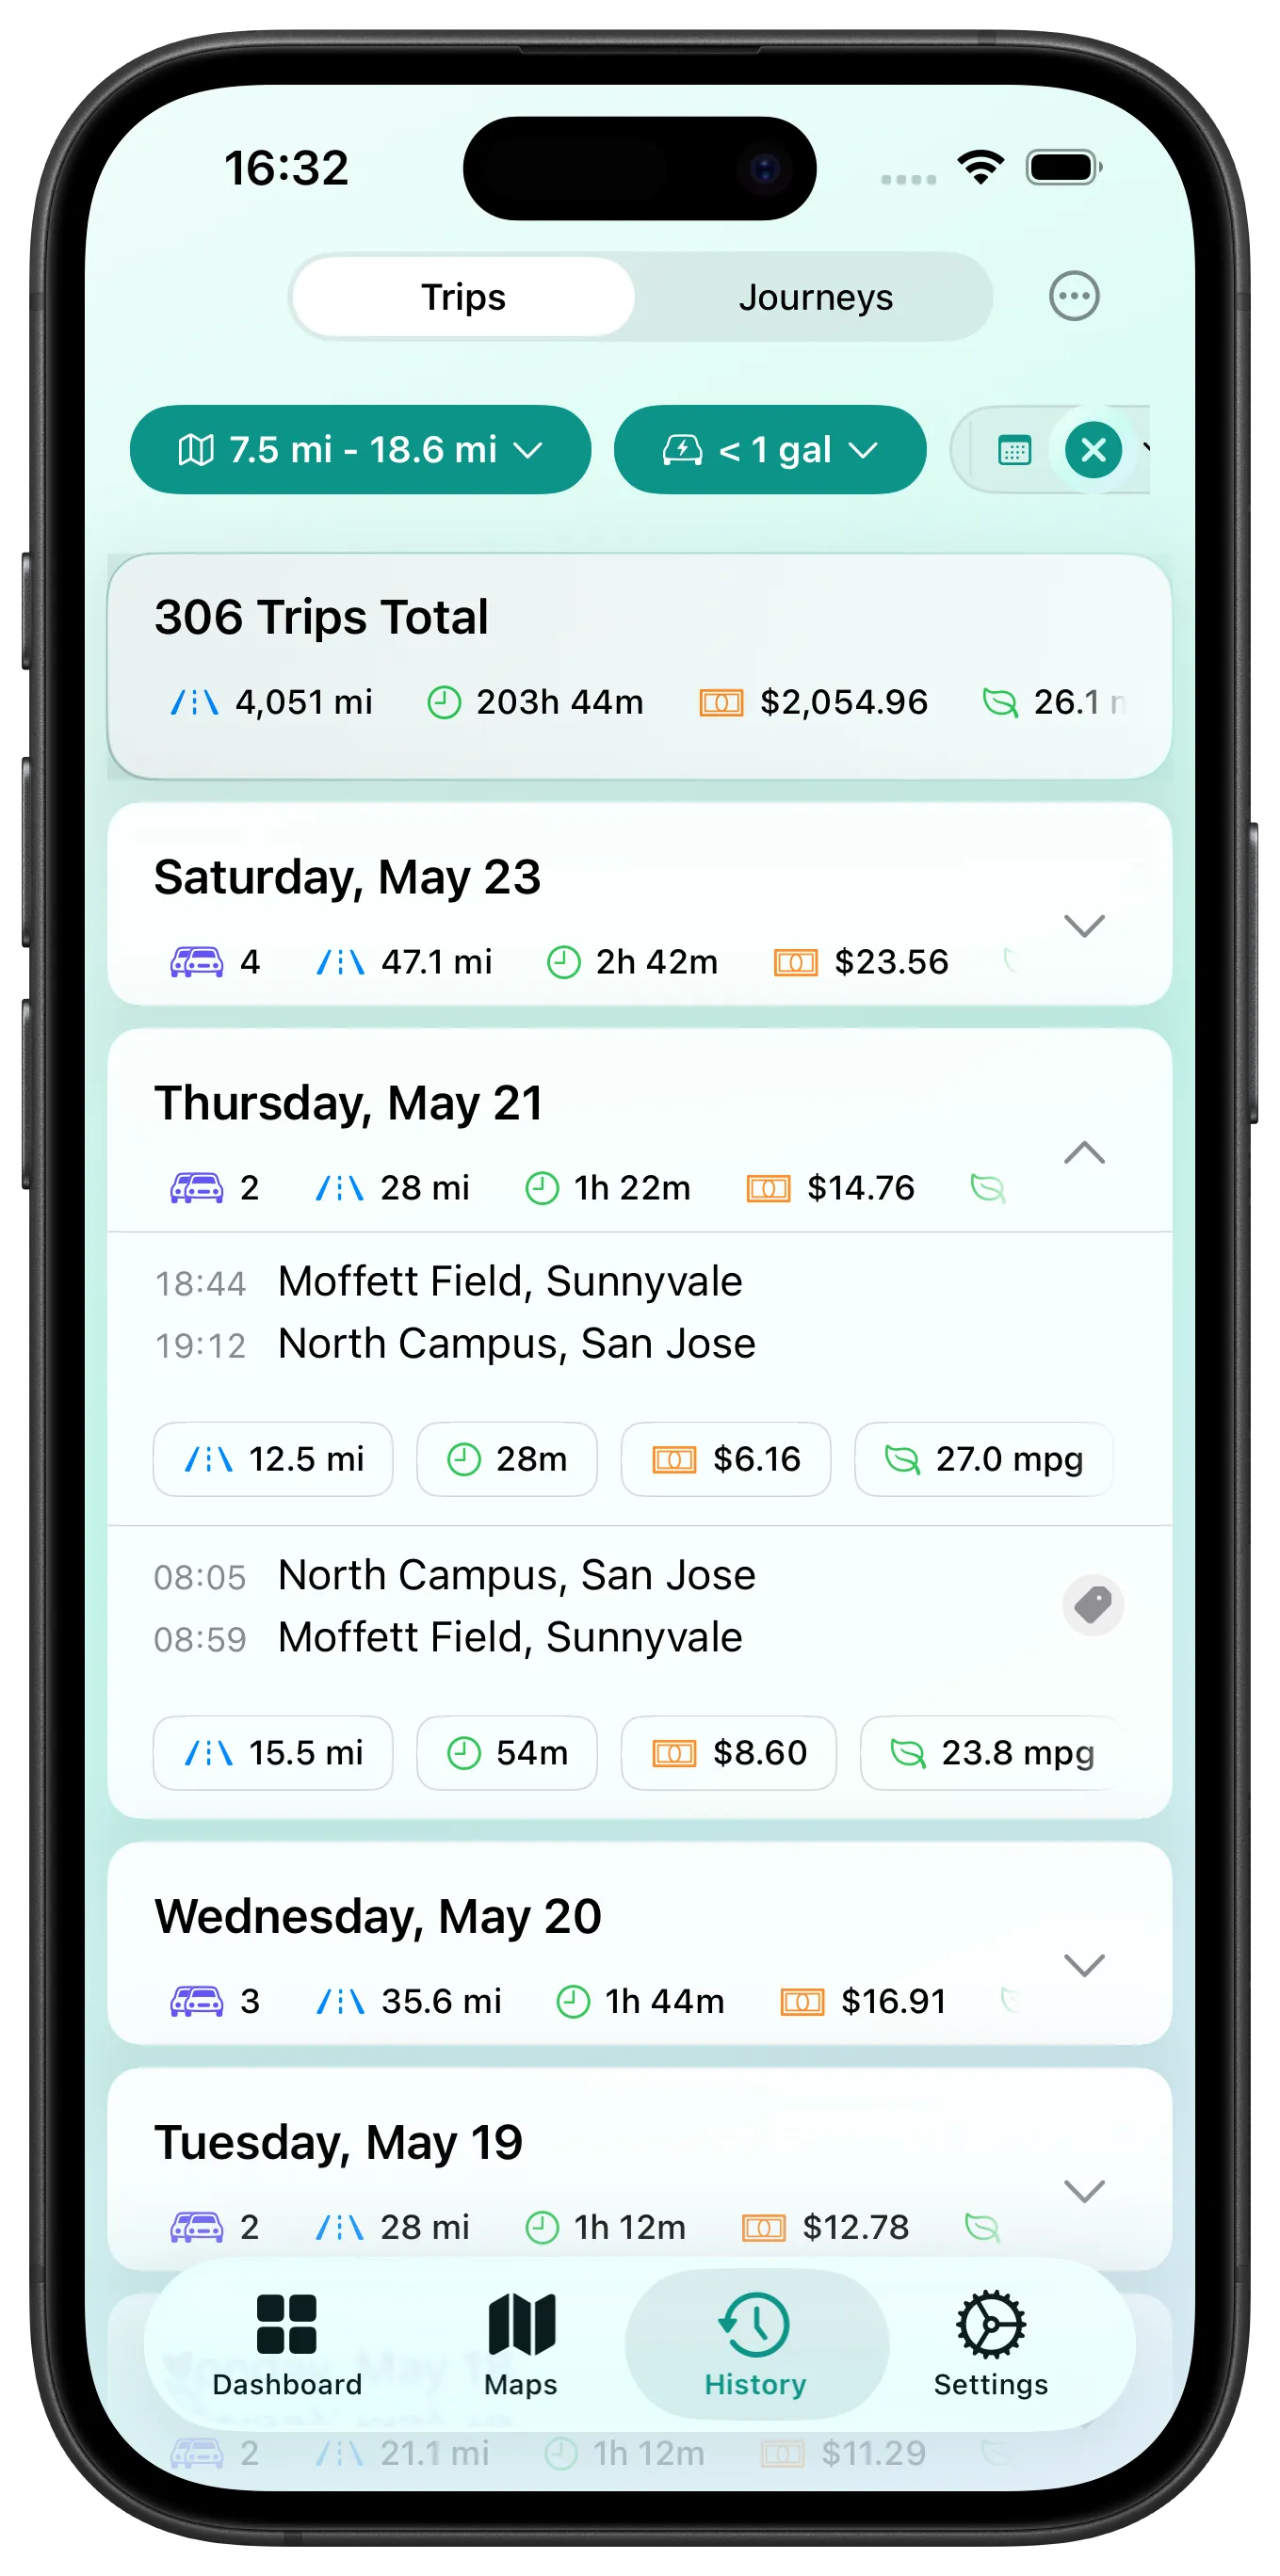
- Trip History — Every trip shows its estimated fuel cost and consumption rate alongside distance and duration.
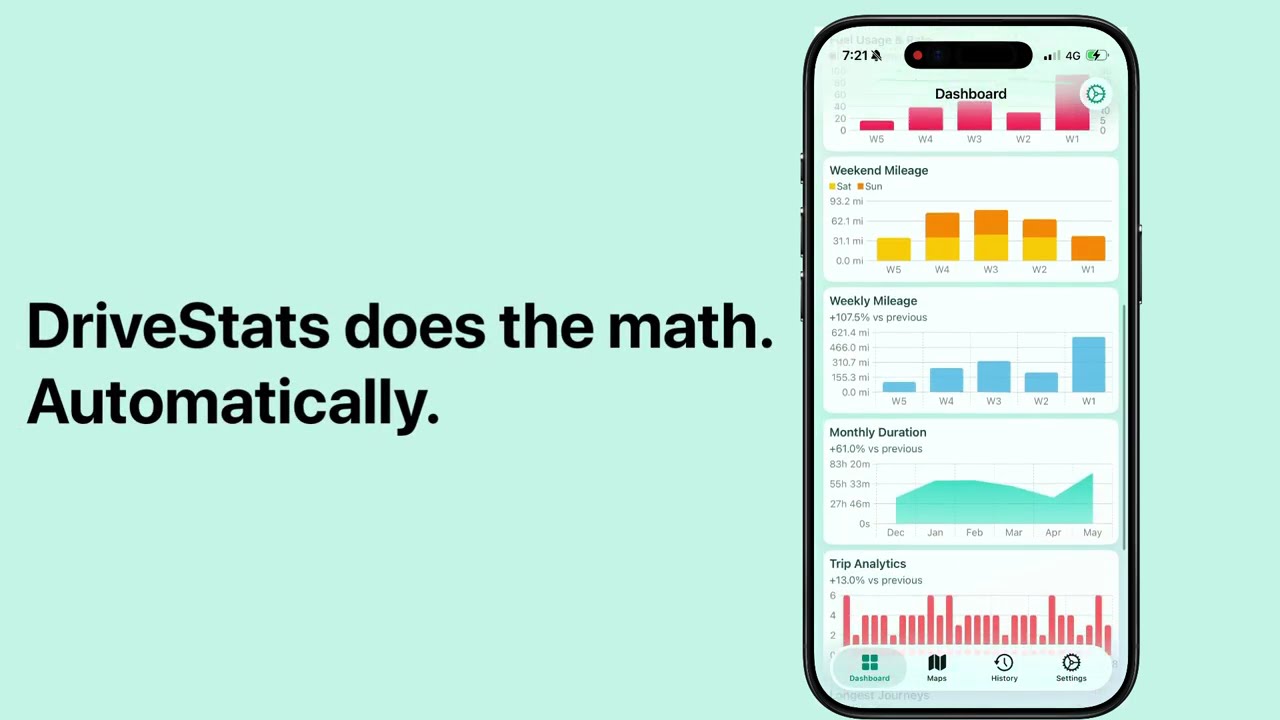
- Dashboard Charts — A brand-new Bar + Line combo chart lets you track fuel metrics over time. Build custom dashboards to spot efficiency trends.
- Advanced Fuel Filters — Search your trip history by consumption rate, fuel used, or total cost. Find your most expensive trips, or filter out efficient ones.
Filter Summary Card
When you filter your trip history (by date, distance, location, or any other criteria), you now see a summary card at the top showing total distance, duration, and total estimated fuel cost for all matching trips. Instantly see what your weekend driving habit costs.
Redesigned Trip Details
The trip details screen has been completely redesigned with a cleaner layout, clearer metrics, and the fuel cost front and center.
Privacy-First by Design
We want to be clear about this: your driving data never leaves your iPhone.
All physics calculations, fuel estimations, chart rendering, and GPS processing happen locally on your device. There are no cloud servers processing your location data. No accounts to create. No analytics tracking your trips. DriveStats works fully offline.
This isn't just a feature — it's the architecture. We built DriveStats this way from day one because your location data is some of the most sensitive information on your phone. Fuel tracking makes that even more true.
Availability
DriveStats v2.0 is available today on the App Store. Update now to start seeing exactly what every trip costs — automatically, privately, and without any extra hardware.
See what every trip costs
Auto trip tracking, fuel cost estimates, dashboard charts — 100% private, on your device.
Download App